ScimBI Dashboard

Create Smart, Beautiful, Augmented Dashboards

A Scim dashboard is the best way to visualize, monitor and understand your data to drive action. That's because they look amazing, are simple to build, and deliver automated insights.

View Dashboard Gallery

SIMPLY THE BEST

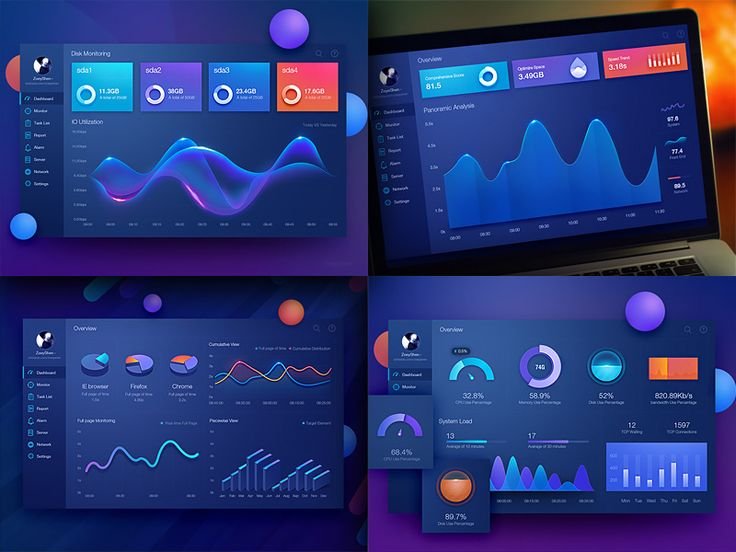
Visualize data from different data sources, spread dashboards over multiple tabs, and bring them to life with sparklines and contextual actions. ScimBI dashboards also support embedded internal or external analytics apps with data storytelling and automation.

BOOK A DEMO
Dashboard Image

Beautiful Dashboards

Designers and end users will love the drag and drop charts, tools, and layout freedom. Create pixel-perfect, brand-aligned visuals with shapes, text, images, and storytelling features.

Beautiful UI

ScimBI Signals

Know when, what, and why something happened with threshold alerts. The suite integrates data discovery, action dashboards, and storytelling to transform your data into insights.

BOOK A DEMO
Signals

Revolutionize Your Data with Storytelling

Unlock your data’s full potential with ScimBI Stories and Present. Blend trends and deep context into compelling narratives that lead to data-driven decisions.

Storytelling

Self-Service BI for Everyone

Enable everyone—from business users to analysts—to explore, discover, and share insights. ScimBI makes self-service simple, governed, and powerful for all.

BOOK A DEMO
Self Service BI